For the full announcement, read the official press release on the launch of Cerkl Insights here
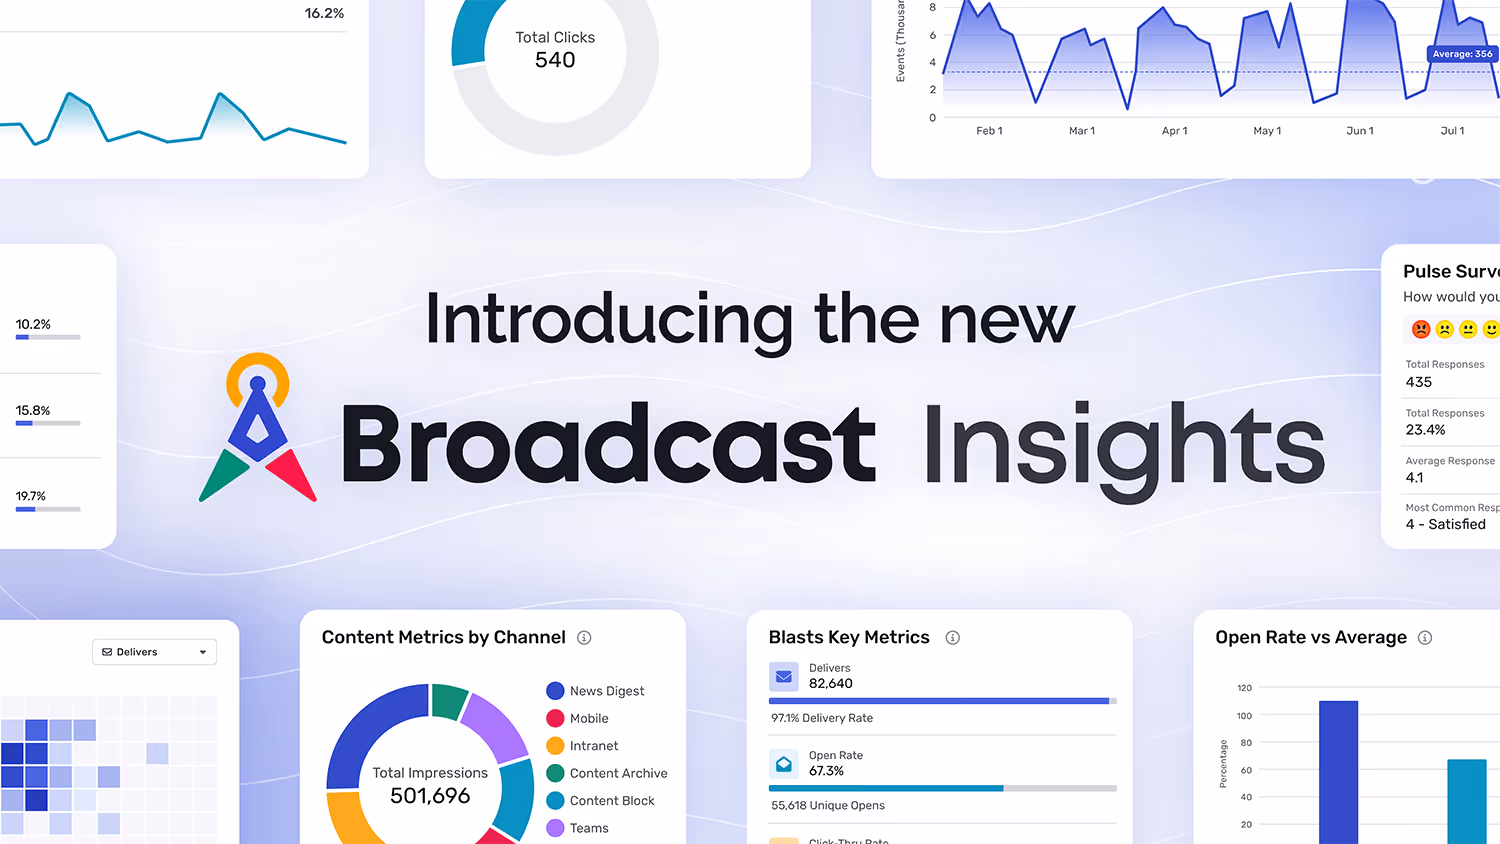
Starting June 20, 2026, every Broadcast customer gets Insights, a ground-up rebuild of the analytics inside Cerkl Broadcast. If you have ever opened your old reports, squinted at a chart, clicked three layers deep, lost your place, and then given up before you found the one number leadership asked for, this release is for you. Insights keeps the data you trust and rebuilds everything around it: the visuals, the navigation, the speed, and the way you share what you find.
The short version is that measuring your internal communications used to take more effort than it should have. Insights fixes that. You can move from a high-level summary to a single subscriber's click history without losing the thread, compare this month against your own running average, and hand a clean dashboard to a stakeholder without exporting anything. This post walks through what changed and how to start using it.
The problem Insights was built to solve
Internal communicators are measured on outcomes but rarely given time to be analysts. You send the all-staff update, the benefits reminder, the policy change that legal needs everyone to read, and then someone asks how it performed. The honest answer often depends on how much patience you have for digging through a reporting tool that was never designed for a quick answer.
That is the gap Insights closes. Tarek Kamil, CEO and Founder of Cerkl, put it plainly when announcing the launch: "Internal communicators are expected to make decisions quickly, often without the time or tools to fully interpret their data. Insights is designed to remove that friction. It gives teams a clearer view of what's working, what isn't, and where to adjust, without requiring them to be analysts."
Removing friction was the whole assignment. The previous analytics experience worked, but it asked too much of the person using it. Insights rebuilds the experience around three things people actually do with their data: see it, navigate it, and share it.
See your data, not a spreadsheet's idea of your data
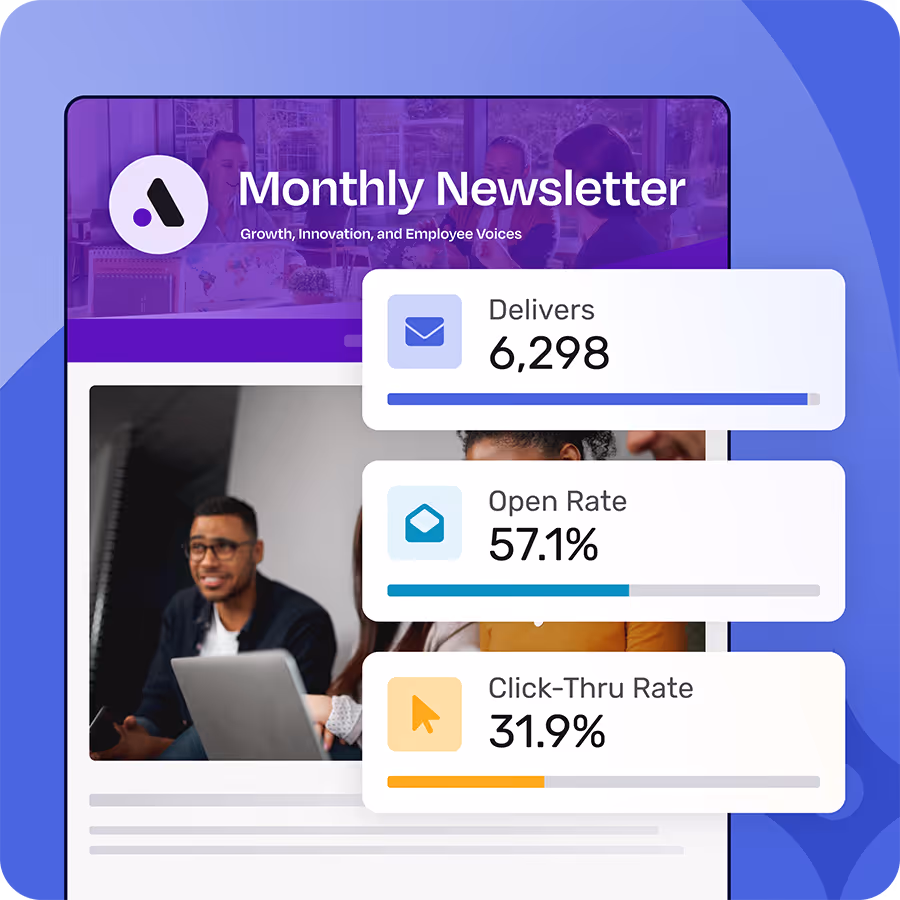
The first thing you notice is the visualization. Insights presents performance through a wider range of visual formats, so trends, comparisons, and outliers are obvious at a glance instead of buried in rows. Open rates over time, clicks by channel, your most and least popular content, the days and hours your audience actually engages, all of it reads as a picture before you have to think about it as a number.
For the people who live in the detail, the customizable tables are the other half of the story. You can add, remove, and rearrange columns so your default view shows exactly the metrics you care about, then export the whole thing when you need it in a deck or a board doc. A communicator who wants a quick visual read and an analyst who wants every column of raw data are both served by the same screen, which is how it should work.
Navigation that gets out of your way
Good data is useless if you cannot find it. The old experience made deeper exploration feel like a maze, so Insights reworked the navigation from the ground up. Breadcrumbs show you where you are. Pathways are consistent from section to section, so the way you got to one report is the way you get to all of them. When you drill into a specific blast or a specific subscriber, you can retrace your steps without starting over.
Speed got the same treatment. Load times are noticeably faster, which sounds like a small thing until you remember how many times a day you open a report, wait, and lose your train of thought. Faster pages mean you stay in the question you were trying to answer.
From the big picture down to a single click
Insights is built as a multi-layered system, which is a technical way of saying you can start high and go as deep as the question demands. The summary view tells you how your communications are performing overall. From there you can move into email and Blast engagement over time, content performance by channel, and audience-level detail that goes all the way down to how one person interacted with one message. You are never stuck at the altitude the tool decided for you.
What makes those numbers mean something is context, and this is where the benchmark comparison earns its place. Insights compares your current performance against your organization's own average from the last 18 months. So a 22% open rate is no longer a number floating in space. You can see whether it is above or below where your audience normally lands, which is the difference between a metric and an actual insight. The little dot on the percentage bar that shows you your rate against your running average is the kind of small touch that changes how you read every report.
You can view all of this across custom or predefined time ranges, from today to this quarter to a date range you set yourself, so the data flexes to whatever question you are being asked this week.
Internal emails shouldn't be a black box.
Foundations shows who opened, clicked, and engaged with your employee communications so you know what’s actually working. All for free - forever.
Learn more about FoundationsEvery channel, in one place
Email is where most teams start, but it is rarely where the story ends. Insights brings channel-level reporting together so you can see how each distribution method performs. Email and Blasts have their own detailed view, including audience reach and link engagement down to which specific people clicked which link. Content reporting breaks down by channel, so you can compare how the same message landed in your News Digest, on Mobile, in the Intranet, in Microsoft Teams, and in the Content Archive.
Two channel details are worth calling out because they answer questions communicators ask constantly. News Digest reporting now surfaces subscriber delivery preferences and category interests, so you can see not just whether the digest is working but what your audience has told you they want from it. And the per-channel activity logs show engagement by day and hour, which is how you stop guessing about send timing and start scheduling around the windows your people actually show up.
Some of this channel reporting, particularly Mobile, Intranet, and Teams, follows the channels your plan includes. The core email and content analytics are available to every Broadcast account, including Foundations, so the day one experience is genuinely useful whether you run one channel or six.
Dashboards you can actually share
Reporting that lives in your head or a screenshot does not help anyone. The redesigned Dashboards let you build custom views and share them, with the governance to keep that sharing under control. You can assemble a dashboard from the blocks that matter to a given audience, give it a time period and a description, and arrange it the way the conversation needs.
Then you decide who sees it. Administrators have full visibility across every dashboard in the organization. Team members can selectively share access for collaboration, and permissions adjust as needs change, so a dashboard built for a quarterly review can open up to a wider group or stay locked to a few people. Rachel Folz, Head of Product at Cerkl, framed why that matters: "Analytics should not stop at reporting what happened. It should help teams communicate what that data means and what to do next. With Insights, we focused on making data easier to understand and easier to share, so it can actually influence how organizations communicate."
That is the part teams tend to underestimate. The point of measuring your communications is to change them, and change happens in conversations with leadership and partners. A dashboard you can hand over, with the right people seeing the right things, is what moves a number from your screen into a decision.
How to start using Insights
Insights is available to all Broadcast customers beginning June 20, 2026, so there is nothing to install and nothing to wait for. You need the View Insights permission to see the pages, and your administrator controls who has it, which is worth a quick check if a teammate cannot find the new experience.
The fastest way in is to open the experience and look at one thing you already report on, your last all-staff Blast, your News Digest, your most-read story, and notice how much less work it takes to get the answer. Change the time range. Watch your rate move against your 18-month average. Build a small dashboard for your next leadership update and share it with one person. The features are designed to reward poking around, and the navigation finally makes that safe to do.
Better internal communication starts with understanding what is actually landing. Insights gives you that understanding faster, with less friction, and in a form you can hand to the people who need to see it. Open it up and start with one question you have been meaning to answer.
If you're frustrated with Outlook or Gmail for your employee emails, we understand.
That's why we built Foundations. Purpose-built for internal email with all the features you wish you had - drag-and-drop email builder, analytics, employee segmentation and much more. All for free (forever). No credit card, no contracts, no setup fees.
Learn more about FoundationsFAQ
When is Insights available?
Insights is available to all Broadcast customers beginning June 20, 2026. There is nothing to install or enable at the account level. If you cannot see it, check that you have the View Insights permission, which your administrator controls.
Is Insights included in the free Foundations plan?
Yes. Insights is part of Broadcast across plans, and Foundations accounts have access to email and content analytics within it. Some channel-level reporting, such as Mobile, Intranet, and Microsoft Teams, follows the channels your specific plan includes, but the core analytics experience is available on Foundations.
What does the benchmark comparison measure?
Insights compares your current performance against your own organization's average over the last 18 months. Instead of seeing an open rate or click-thru rate in isolation, you see whether it sits above or below where your audience normally lands, which gives the number context you can act on.
Can I share an Insights dashboard with people outside my team?
Yes. The redesigned Dashboards let you build custom views and share them with governance built in. Administrators have full visibility across all dashboards, team members can selectively share access, and permissions adjust as your needs change, so you can balance transparency with control.
What channels can I report on in Insights?
Insights offers channel-level reporting across Broadcast, including email and Blasts, content by channel, News Digest delivery preferences and category interests, Mobile, Intranet, and Microsoft Teams. Available channels depend on your plan.
Did you enjoy this content?
Please share it with your internal comms friends and colleagues.
Just click on any of the links below.